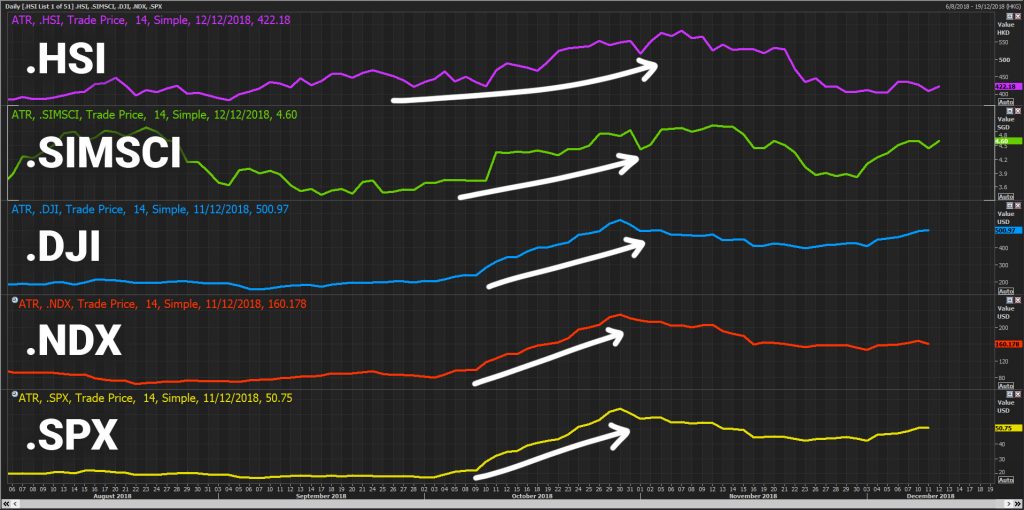
With the increased volatility in the markets seen since mid October, it has been increasingly difficult to make clear predictions of where the potential day high and low will be in our RHO Index Key Levels service.
Seen below: 14-Day Average True Range (an indicator that measures volatility) for HSI, SIMSCI, DJI, NDX and SPX

Very often, the trade plans will reveal more than one possible top or bottom for the day. While we want to err on the safe side and provide you the levels with the lowest risk, we are also committed to providing you (especially the advanced traders) more trading opportunities.
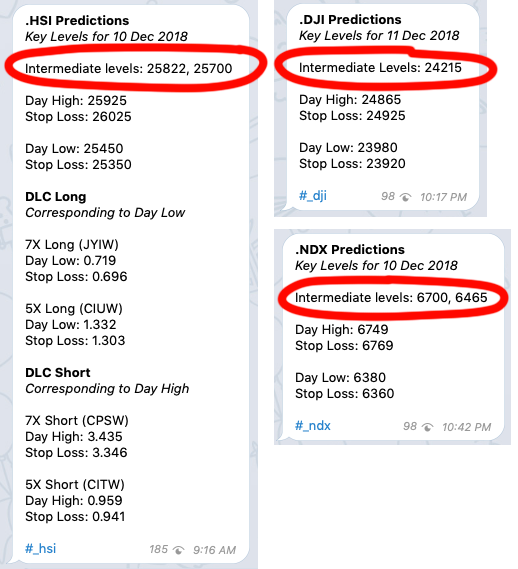
So, we have introduced the intermediate levels – as you may have seen in the recent predictions.

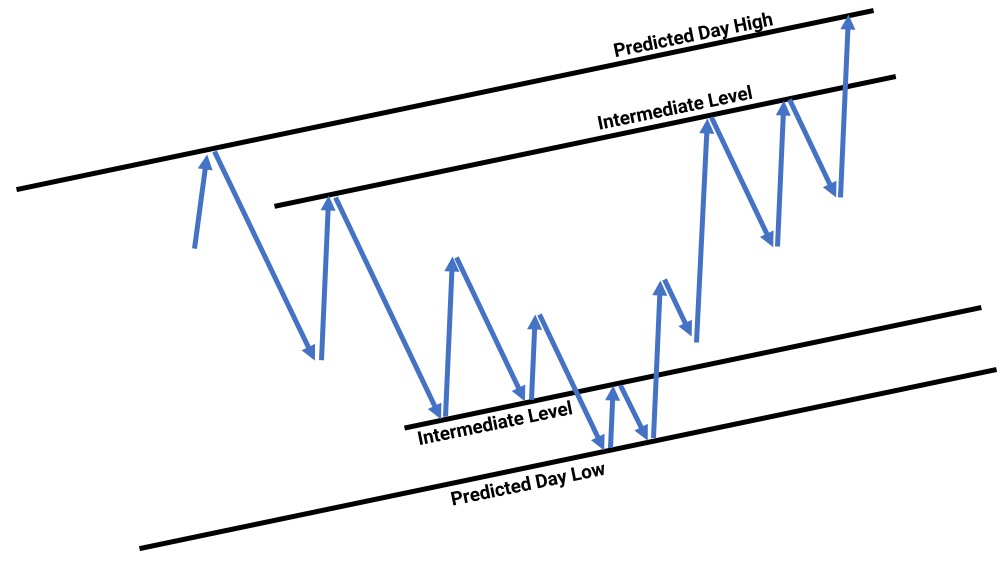
The intermediate levels also mark the strong support and resistance levels for the day, and will also be potential levels where the price make peak or bottom for the day.
Here is a quick illustration of how the intermediate levels are derived.

How do you use them in your trades?
If you are an advanced trader, you can make use the intermediate levels provided for additional guidance for your trades. Please ensure that the price has made a reversal after hitting the intermediate levels, before using it to enter a new position.
If you already have an open position when price hits one of the intermediate levels, this can also possible point for you to take a partial profit.
Note that there are no specific stop loss levels when trading the intermediate levels, so you will need to use your own discretion if the trade turns against your position. This is because technically the trade is still in play (still within the wider channel).
What if I am just getting started?
We would recommend you stick to the original recommended strategy of only entering a trade when the price reverses after hitting the predicted day high / low.
There may be lesser trading opportunities during this period of wild volatility, but hopefully this will roll over and we can all have a smoother trading experience soon. (Fingers Crossed!)
Happy trading!